Closing your fleet budget by looking only at the total spend is an excellent way to find out how much money was spent. It is considerably less useful for understanding why.
Between fuel, maintenance, contracts, insurance and vehicles that have quietly started costing more than they should, the overall figure can hide significant differences in your fleet costs.
Before closing the year and starting to plan the next one, it is worth taking a closer look at your fleet costs and understanding where the budget is actually going. fleets costs, com um pouco mais de detalhe.
Start with the cost of each vehicle
A fleet of 50 vehicles does not have just one cost. It has 50.
Two vehicles in the same category can end the year with completely different costs. One went through its scheduled servicing and little else. The other accumulated repairs, tyres, above-average fuel consumption and several days off the road.
When all these costs appear only in the fleet total, both vehicles seem to contribute in the same way.
They do not.
Analysing the cost per vehicle makes it possible to identify vehicles that are moving away from the norm and understand which costs are worth investigating, which vehicles may need replacing, and which expenses should no longer simply be assumed to be “normal”.
Compare the budget with the actual cost
The budget said €X. Reality came back with €Y.
The interesting part lies in the gap between the two.
More important than knowing there was a variance is understanding where it happened.Was it fuel? Maintenance? Insurance? Were there more unplanned repairs? Did certain vehicles cost more than expected?
This comparison is what makes fleet cost management useful when planning the next budget. Otherwise, next year’s forecast risks being little more than this year’s budget with a few extra percentage points added.
Look at the cost per kilometre
The absolute cost can be misleading.
A vehicle that costs more but covers significantly more kilometres may be more operationally efficient than one with a lower annual cost.
That is why cost per kilometre helps put expenditure into context and allows vehicles with different levels of usage to be compared. It is also an important metric in the economic analysis of a fleet.
If this figure is rising consistently, there is something worth investigating before closing the budget.
Don’t look at fuel as just a total
“We spent €80,000 on fuel” is information.
“These five vehicles increased their fuel cost per kilometre over the last three months” gives you something you can act on.
When analysing fleets costs,it is important to compare fuel consumption, kilometres travelled, previous periods and equivalent vehicles. A persistent difference may be related to usage, driving behaviour, routes or even the condition of the vehicle itself.
The goal is not simply to know how much was spent. It is to identify what is changing the trend.
Look at how much each vehicle costs to maintain
A single repair may not tell you much. Five interventions on the same vehicle over the course of a year tell you considerably more.
Before closing the budget, it is worth analysing the maintenance history of each vehicle, the frequency of interventions and the accumulated cost.
This is where more useful questions start to emerge:
- Does this vehicle still make sense for the fleet?
- Are its maintenance costs increasing?
- Are there recurring faults?
- Are we spending money to postpone a replacement decision?
Total cost of ownership (TCO) is widely used to assess vehicle acquisition and replacement decisions over time.
Then look at what hasn’t happened yet
Not every cost in your next budget is hidden.
Some already have a date.
Contract renewals, insurance, scheduled maintenance, inspections and the end of vehicle leasing agreements can all be anticipated and factored in before the budget is finalised.
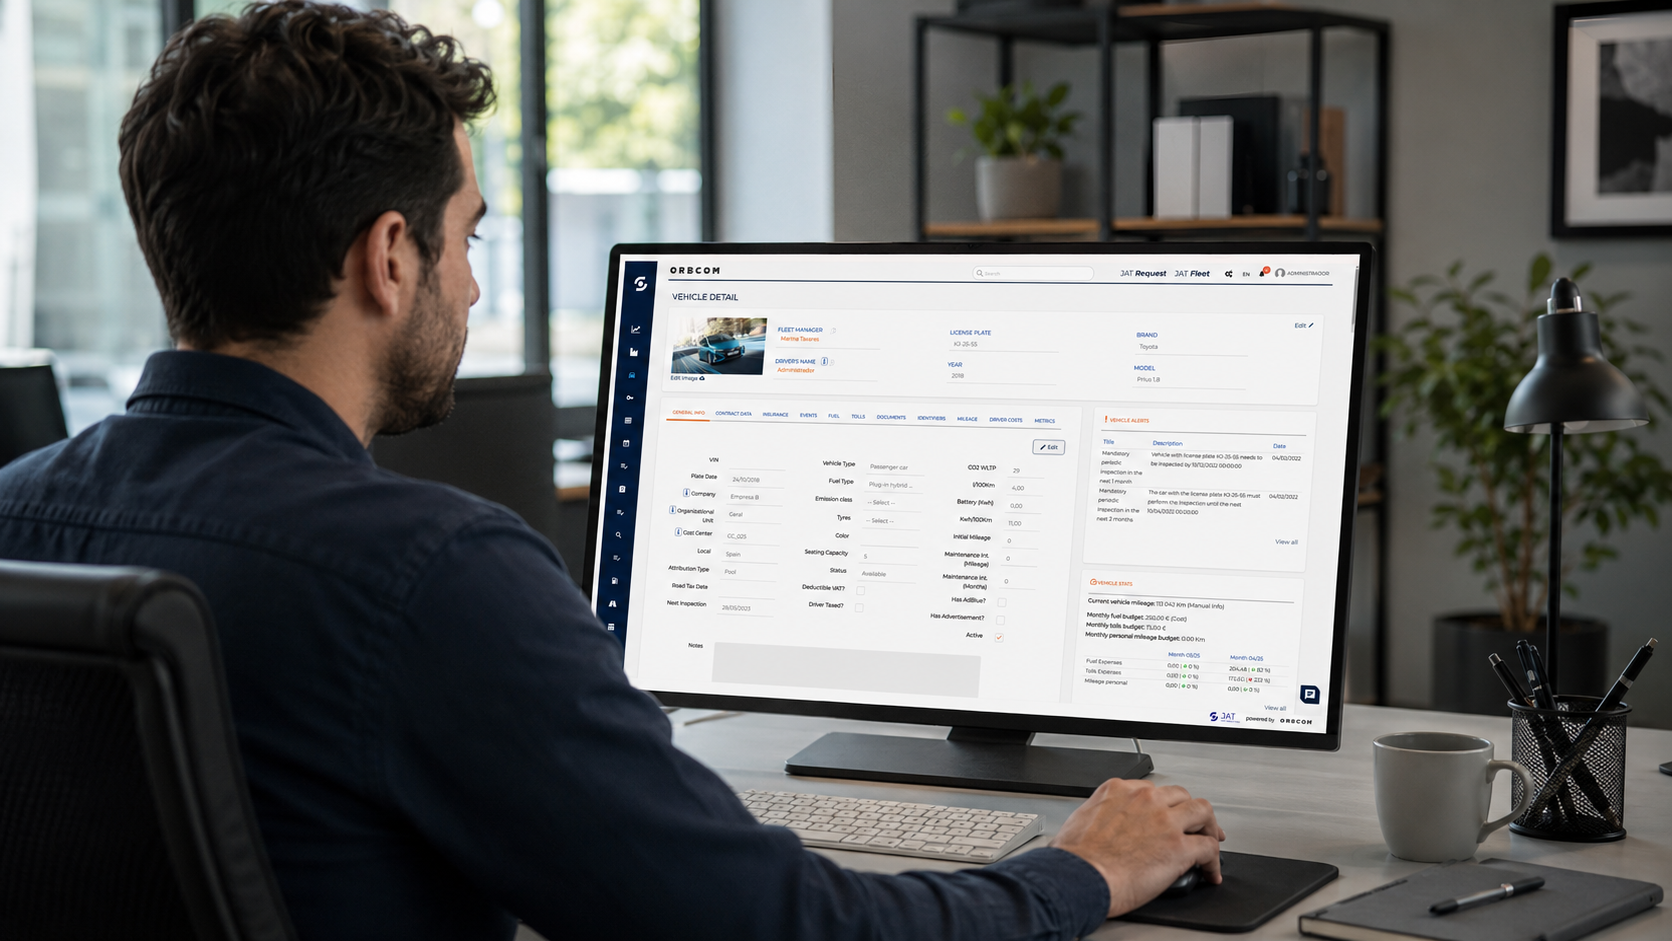
This is where real-time dashboards become particularly valuable.
When costs, contracts, maintenance and each vehicle’s history are centralised, fleet managers no longer have to reconstruct the state of the fleet at the end of the year. They can monitor key indicators as they change and approach budget planning already knowing where the variances are.
Because a dashboard is not there to provide nice-looking charts for a meeting.
It is there to make sure the meeting does not start with:
“Wait. Why did this vehicle cost so much?”